Diagnose MacBook Pro: a troubleshooter's guide by symptom
When a MacBook Pro misbehaves, the symptom usually maps to a specific Apple Diagnostics prefix (PPT for battery, VFD for display, NDK for keyboard, PFM for SMC, PPM for memory). This is the symptom-to-test mapping plus the manual spot-checks Apple Diagnostics doesn't catch.

Diagnose MacBook Pro: a troubleshooter's guide by symptom#
When a MacBook Pro misbehaves, the symptom usually maps to a specific Apple Diagnostics prefix: PPT for battery, VFD for display, NDK for keyboard, PFM for SMC, PPM for memory. This is the symptom-to-test mapping plus the manual spot-checks Apple Diagnostics does not catch.
Apple Diagnostics is a presence and electrical-threshold test, not an exhaustive functional test. A single dead key, an intermittent display flicker, and a Thunderbolt port that fails only at full 40 Gb/s under sustained throughput can all pass with ADP000. The codes are starting points, not verdicts. For the underlying tool stack, every method for running diagnostics on a Mac compared is the umbrella piece.
Battery: won't hold charge, capacity dropped suddenly#
Read three numbers. Cycle count in System Information → Power → Battery Information against Apple's published limit (1000 cycles for every MacBook Pro from 2010 onward). Maximum Capacity % in System Settings → Battery → ⓘ; below 80% flips Condition to Service Recommended. Apple Diagnostics PPT code.
PPT grading on sight: PPT001 means battery not detected (AASP); PPT002/PPT003/PPT007 mean "you can keep using it"; PPT004 on Intel warrants a rerun over the internet with Option-D before service, on Apple Silicon means AASP if it repeats; PPT005 means installed improperly (AASP); PPT006 means service required; PPT021 means below 6% charge, recharge and rerun.
A single PPT code rarely means the Mac is failing. macOS can flag a healthy battery as Service Recommended at very low cycle counts (155 or 179 cycles in documented cases) after a major OS update. Always rerun Apple Diagnostics to confirm a PPT code before paying.
Battery Health Management on Apple Silicon notebooks (support.apple.com/en-us/102589) monitors temperature history and charging patterns; Maximum Capacity % can fluctuate ±5% even on a healthy battery. pmset -g batt | grep "Charge limit" returns Charge limit: on when macOS has capped charging at 80%. For the full BHM read, the 1000-cycle rating walkthrough covers the dynamics.
Display: flicker, vertical lines, dark patches#
VFD001 through VFD007 on the integrated display almost always means a full display-assembly replacement, expensive on Retina and Liquid Retina XDR panels. VFD008/VFD009 mean HDMI controllers; VFD010 means the Apple I/O card needs reseating; VFD011 the antenna connector board.
Manual spot-checks Apple Diagnostics misses: tilt the panel through its full range (backlight blotches and flexgate-stage dark patches appear at specific angles); open a solid-white wallpaper then solid black (stuck pixels, screen burn, pressure marks); connect an external display via HDMI and via USB-C/Thunderbolt (a failing laptop-side display assembly passes ADP000 if external output works).
A flexgate-stage Pro panel (2016 through early-2018 Touch Bar generation, where the display flex cable wears against the chassis as the lid opens and closes) can pass Apple Diagnostics and still show dark patches across the bottom at hinge angles past about 90 degrees. The diagnostic is electrical-threshold; flexgate is mechanical wear.
Keyboard: sticky or dead key#
NDK001 catches some keyboard faults; it misses intermittent stuck keys, which is the failure mode that matters most on the 2016-2019 butterfly-keyboard MacBook Pro generation. Manual spot-check: open a text editor and type every key, including modifier combinations. Apple's butterfly-keyboard service program covered the 2015-2019 generations and may still apply on a unit you are diagnosing. Touch Bar issues return DFR001 on 2016-2019 Pros; M1 Pro forward the Touch Bar is gone.
Thermal: shutdown or sustained throttling#
Apple Diagnostics catches fan failures (PPF001, PPF003, PPF004) but does not reproduce hours of sustained load. For that, the kernel exposes thermal pressure:
sudo powermetrics -s thermal -i 1000
The output includes a Current pressure level field with values Nominal / Moderate / Heavy / Trapping. Heavy means the Mac is actively throttling. asitop (pip install asitop, needs sudo) and macmon (Rust, no sudo) give the same data in an htop-style view.
Real numbers: an M2 Pro/Max under sustained Cinebench or Blender can reach about 100 degrees Celsius at the package and drop P-core clocks from about 3.2 GHz to about 2.1 GHz within a minute, a 30 to 40% throughput loss. If fans never spin up under load, check for PPF codes; if fans ramp and the machine still cuts out, the thermal-paste path or heat-pipe has degraded. For a reproducible stress test, the Cinebench plus Blackmagic plus Apple Diagnostics battery covers the sequence.
Kernel panic on cold boot#
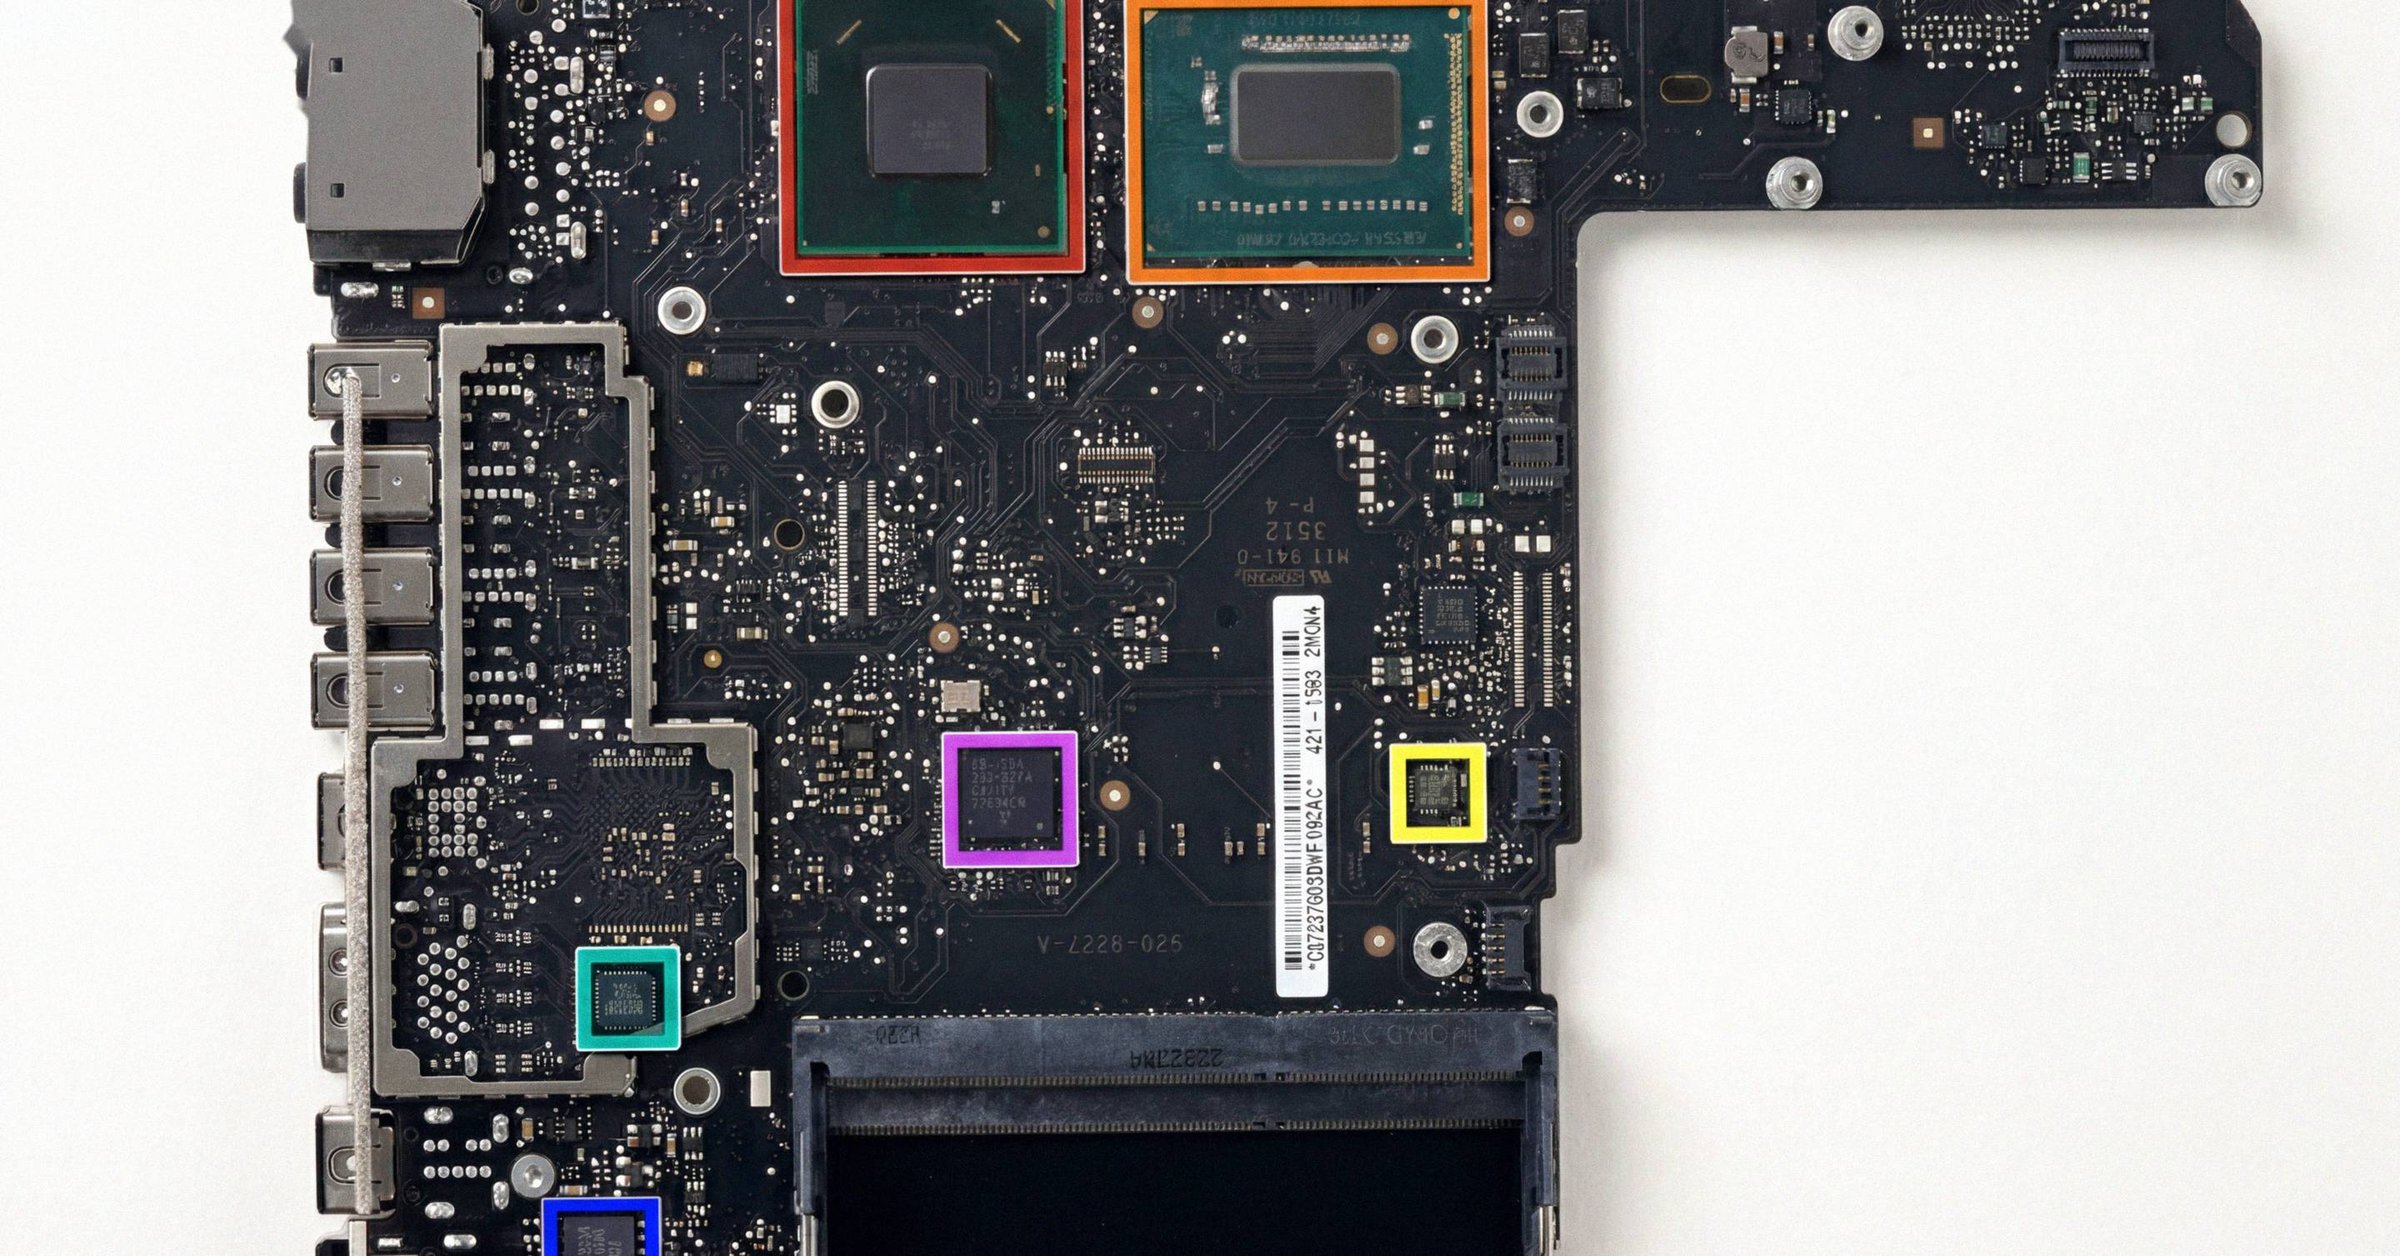
A repeating panic across cold-boot reproductions with no recent software change points at hardware. On a follow-up Apple Diagnostics run, the codes that signal logic-board territory: PPM (memory; on a soldered-memory Apple Silicon Mac, PPM001-PPM016 mean a logic-board replacement), PFM (SMC/PMU, often traceable to liquid ingress or thermal stress severing a communication trace), PFR (firmware), PPR (processor).
Read the panic itself. Console.app → Reports → System Reports → look for Kernel*.panic files in the last 30 days. The format includes a stack trace and a "Kernel Extensions in backtrace" section that fingerprints which subsystem panicked. A panic that consistently references AppleSMC is consistent with a PFM-grade fault even when the diagnostic returns ADP000 on a single run; rerun 2 to 3 times for intermittent codes.
The Unsafe Shutdowns counter in NVMe SMART counts every power loss that bypassed an ordered shutdown. High counts on a notebook usually mean force-holds of the power button or kernel panics, not dying hardware, but a rising counter on a previously-stable Mac is worth investigating.
One port stops working#
Disconnect external peripherals and rerun Apple Diagnostics. NDD001 (USB) and NDT001 through NDT006 (Thunderbolt) typically clear; NDR007 means "external input device detected, disconnect it." If a code persists with no peripherals attached, the port controller is failing; AASP.
The failure Apple Diagnostics misses: a Thunderbolt port that fails only at full 40 Gb/s under sustained throughput. The test verifies presence and electrical tolerance, not sustained bandwidth. Cycle each port with a known-good 40 Gb/s device (external GPU enclosure, NVMe enclosure, 6K display) and watch for dropped frames, disconnects, or reduced negotiated speed under load. A port that renegotiates to USB 3.x speeds under load is a separate failure mode the diagnostic does not catch.
Wi-Fi flaky#
CNW codes graduate from hardware to environment: CNW001, CNW003-CNW006, CNW009 indicate Wi-Fi hardware (AASP); CNW007, CNW008 indicate no Wi-Fi networks detected (out of range or radio fault, rerun in range). Ethernet (CNT001-CNT007) and Bluetooth (NDL001, NDL002) point to logic-board radios and PHYs; router or cable changes will not fix them.
The software-side tool is separate: Option-click the Wi-Fi menu → Open Wireless Diagnostics. Different layer of the stack. Network problems that look like hardware but are not: aggressive MDM Wi-Fi profiles, an expired enterprise 802.1X certificate, an outdated PSK on a router that rotated keys, Apple's own Private Wi-Fi Address rotation. All environment-side and invisible to Apple Diagnostics.
What Apple Diagnostics will never catch#
A single dead key (NDK001 misses intermittents). An intermittent display flicker that does not happen during the 2 to 5 minute window. Flexgate-stage dark patches at specific lid angles. A Thunderbolt port that fails only at full 40 Gb/s under sustained load. SSD endurance and wear (no view of NVMe Percentage Used; that lives in sudo smartctl -a /dev/disk0, decoded per field). Sustained-load thermal throttling under hours of real workload. Battery condition beyond the binary PPT codes. Repair history (the Parts & Service walkthrough covers the Tahoe 26 surface for Apple Silicon).
ADP000 plus manual spot-checks beats ADP000 alone.
What this means for the reader#
A MacBook Pro acting up usually produces an Apple Diagnostics code that points at the right subsystem. Board-level codes (PPM, PPR, PFR, PFM, VFD on integrated displays) signal real cost. Fix-and-rerun codes (NDD, NDT, PPP, CEH, NDR007) are usually a peripheral or poorly-seated card.
The intermittents are what trip people up. None of them show in a 2 to 5 minute electrical-threshold test. Pair Apple Diagnostics with manual spot-checks. When a code persists across reruns, Command-G on the results screen reboots to a Safari page that pre-fills Apple's support flow with your serial and codes. For a Macfax pre-purchase pass that bundles cycle count, Percentage Used, Parts & Service status, and ADP000 into one device-bound report, a signed Macfax diagnostic report covers the buyer-facing surface.
Related posts
How to use Apple Diagnostics: invocation, ADP000, and what to do next
Apple Diagnostics returns one of two things: ADP000 (no issues found) or a three-letter-plus-three-digit code. ADP000 is shallow by design. Here's how to read the result, when to rerun, and which third-party tool fills which gap.
How to run diagnostics on a Mac: every method compared
There are five consumer-accessible ways to test a Mac's hardware health (Apple Diagnostics, CoconutBattery, smartctl, DriveDx, EtreCheck) and one technician-only stack you cannot run yourself. Each answers a different question. Running one is not running all five.
Apple M4 chip: how to verify yours is genuine
Verifying a used M4 Mac is mostly four checks: About This Mac plus system_profiler for the chip line, Apple Diagnostics for PPR/PPM/PFR codes, the Parts & Service pane for a Genuine logic board, and recognizing the AST 2 report offers that are always fraudulent.
Written by
Marcus WilliamsMarcus Williams covers Mac hardware and repair for Macfax. He spent six years on the bench at an Apple Authorized Service Provider in the Pacific Northwest before going independent, most of that time on logic-board repair, display assembly swaps, and the failure patterns Apple's diagnostics don't surface. He writes about what's inside a Mac, what breaks first, and what a serial number can and can't tell you about a unit's history.
More posts by Marcus →