Mac diagnostics: the complete 2026 guide
Apple Diagnostics is the only Apple-sanctioned hardware test built into every Mac since 2013, and a clean run returns reference code ADP000. This is the full 2026 guide: how to run it, the technician-only stack that isn't accessible to you, and the third-party tools (CoconutBattery, smartctl, DriveDx, EtreCheck) that fill the gaps Apple deliberately hides.

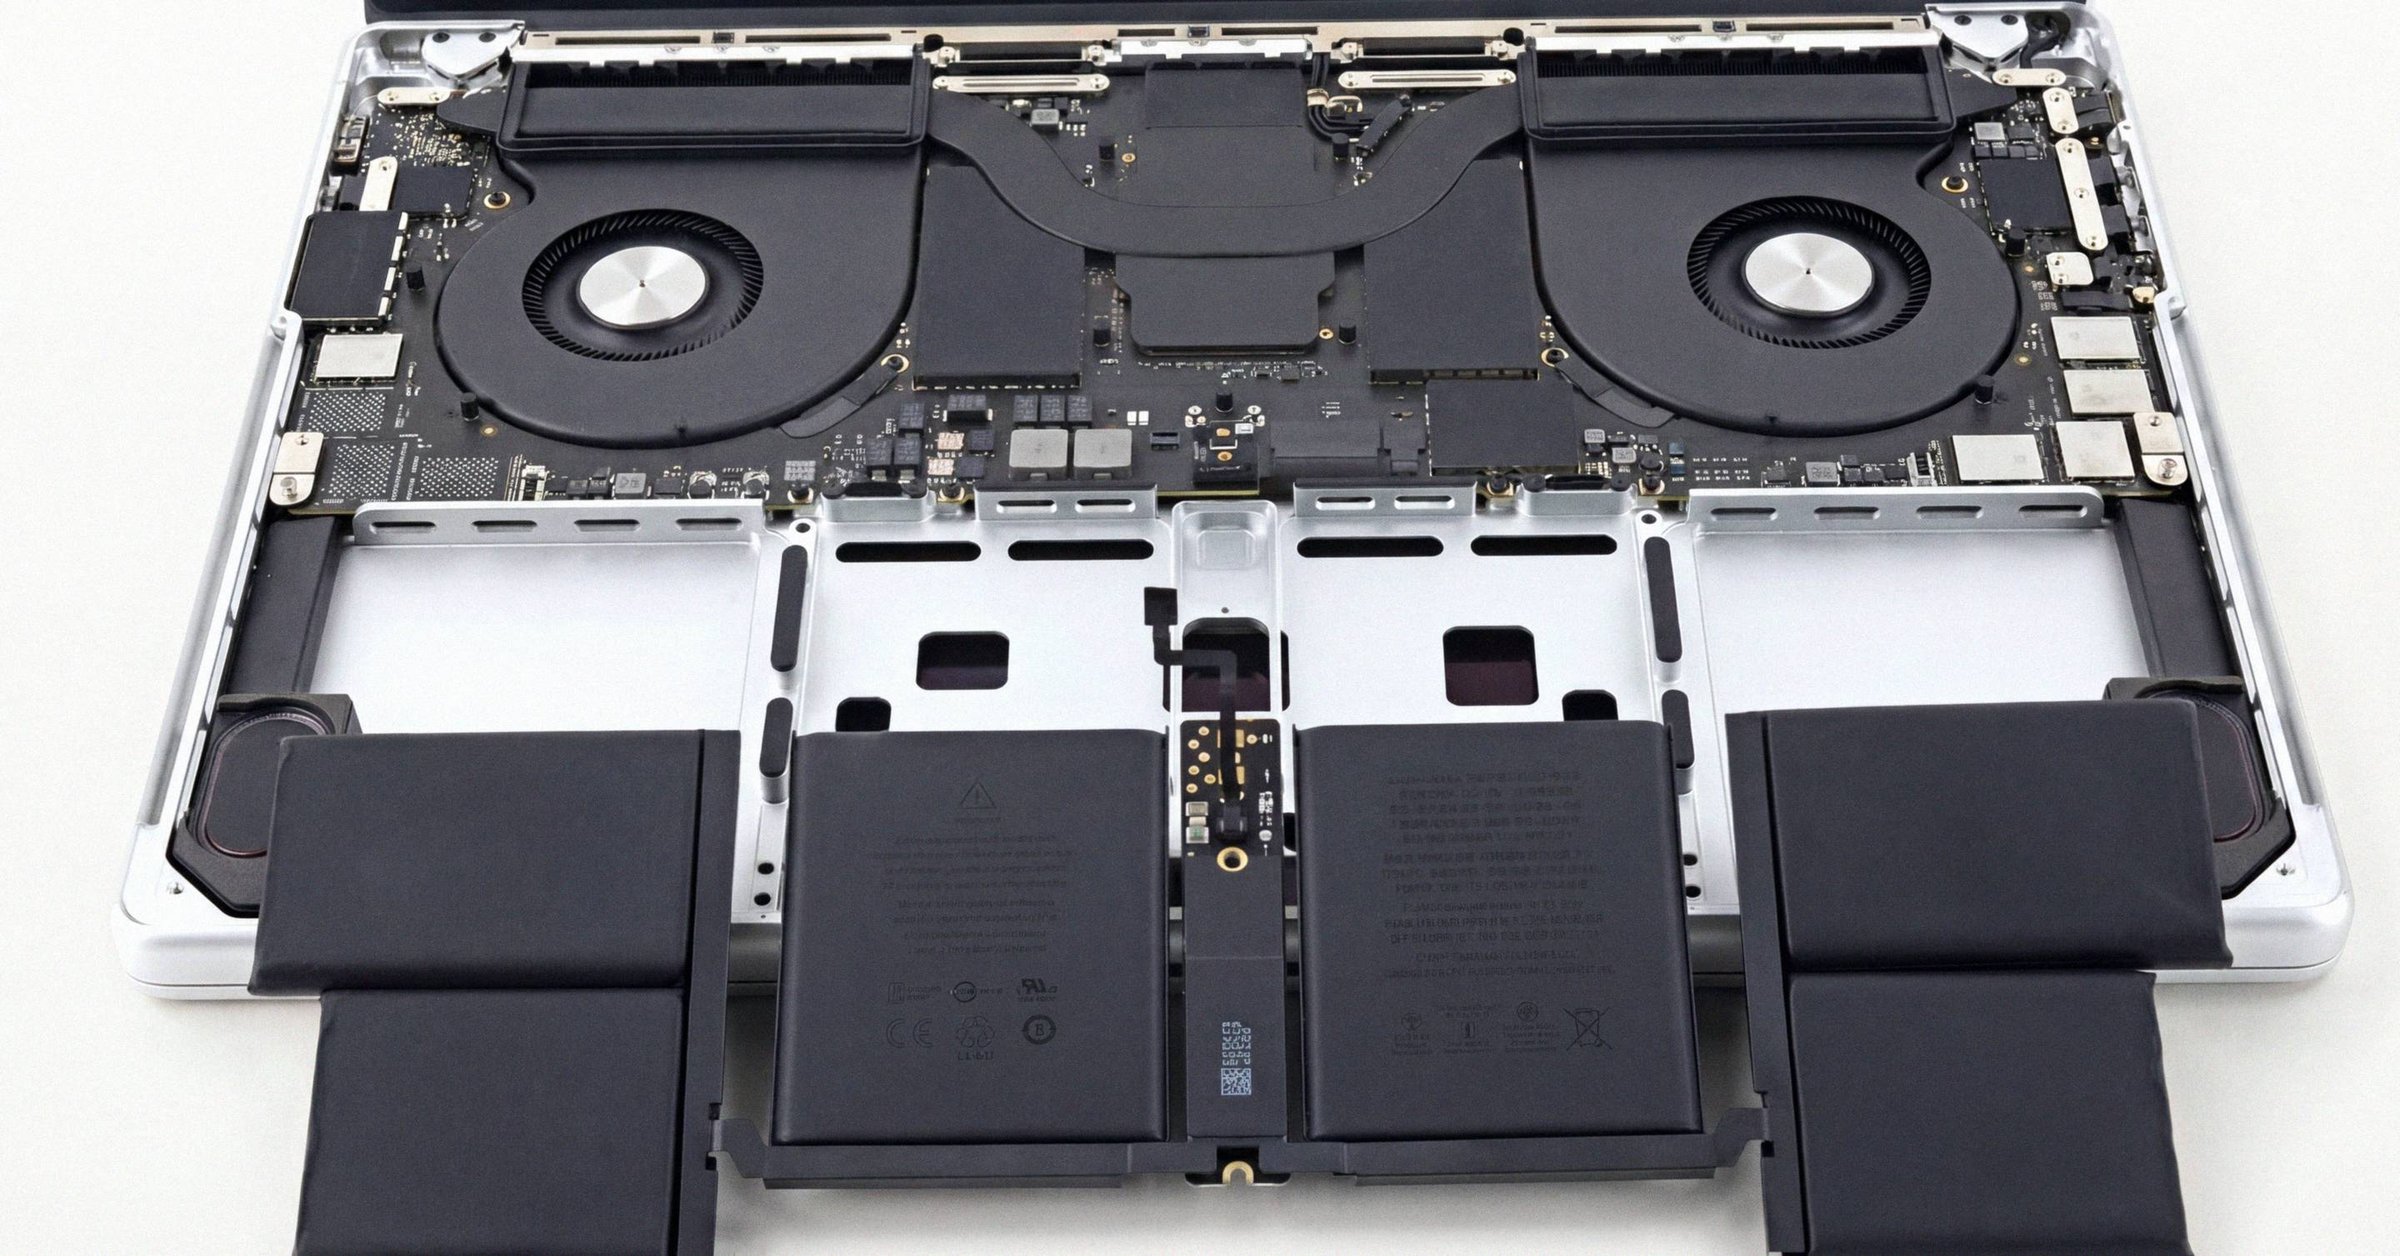
Mac diagnostics: the complete 2026 guide#
Apple Diagnostics is the only Apple-sanctioned hardware test built into every Mac shipped since approximately June 2013. A clean run returns reference code ADP000. A typical run finishes in 2 to 5 minutes. Apple publishes the full code list at support.apple.com/en-us/102334.
That is the floor. It is also where most "how to diagnose your Mac" articles stop, which is a problem, because Apple Diagnostics is a presence and electrical-threshold test, not an exhaustive functional test. A single dead key, an intermittent display flicker, and a Thunderbolt port that fails only at full 40 Gb/s can all return ADP000. The test confirms monitored components are within sensor and electrical tolerances; it does not guarantee every feature works.
The 2026 diagnostic stack is four layers. Apple Diagnostics is the floor. The technician-only Apple Service Toolkit 2 (AST 2) is the ceiling, and is not accessible to you. CoconutBattery, smartctl, DriveDx, and EtreCheck are the third-party tools that fill the gaps Apple deliberately hides in consumer-facing surfaces. The Parts & Service pane in macOS Tahoe 26 closed one specific gap (non-genuine replacement parts on Apple Silicon Macs) that the previous three layers could not see.
This guide walks each layer end-to-end, then maps which tools answer which question, and closes with the pre-purchase and pre-listing workflows that turn the data into a decision. For the device-bound counterpart that pulls these numbers off a Mac into a single signed report, the full Macfax diagnostic walkthrough covers the Macfax side.
Layer 1: Apple Diagnostics#
Invocation differs by architecture#
On Apple Silicon (M1/M2/M3/M4/M5), traditional keyboard boot interrupts are disabled at the bootloader level to enforce the secure boot chain managed by iBoot and the Secure Enclave. The procedure:
- Shut down the Mac (Apple menu → Shut Down; hold power roughly 10 seconds if frozen).
- Disconnect peripherals except keyboard, mouse, display, Ethernet (if used), and AC power.
- Press and hold the power button (Touch ID on laptops; the rear physical power button on desktops). Keep holding past the Apple logo.
- Release when the startup options window appears, showing your startup disk and a gear icon labeled "Options."
- Press and hold Command-D. The Mac reboots into Apple Diagnostics.
- Choose a language, agree to terms, and if prompted choose Run Offline (or wait for an online test if a technician initiated one remotely).
On Intel:
- Shut down.
- Disconnect peripherals.
- Turn on the Mac and immediately press and hold the D key.
- If D does not work (the local diagnostic files are missing, or the drive was replaced), reboot and hold Option-D to force an internet-based diagnostic, which downloads the hardware-specific payload from Apple's servers over Wi-Fi or Ethernet.
Apple recommends placing the Mac on a hard, flat, ventilated surface (fans may spin up).
Reading the results#
ADP000 means no issues found. Anything else is a three-letter prefix plus three digits where the prefix identifies the subsystem: PPT (battery), PPM (memory), VFD (display/GPU), NDK (keyboard), NDR (trackpad), NDT (Thunderbolt), CNW (Wi-Fi), PFM (System Management Controller), PFR (firmware), PPR (processor), PPP (power adapter), and so on. The complete prefix index and the codes that warrant service versus a fix-and-rerun is its own piece.
The results screen offers four actions: Command-R or "Run the test again" reruns the test; R restarts normally; S shuts down; Command-G or "Get started" reboots to a Safari page that pre-fills Apple's support flow with your serial number and codes.
Online vs offline; Tahoe 26 change#
The on-disk diagnostic image refreshes from Apple's servers when online; recent Macs fall back to the local image if they cannot reach Apple. The online path transmits the serial, component identifiers, and telemetry, and is the path Apple Support requires to log an official evaluation. For a battery code on Intel, Apple specifically recommends rerunning over the internet with Option-D before scheduling service.
Starting with macOS Tahoe 26, the pre-boot utility shifted from a single automated sequence to an interactive, user-selectable suite: you can target a specific subsystem (display, keyboard, trackpad, ports) for standalone validation rather than running every check in order. The change matters for pre-purchase and pre-listing workflows because the most negotiation-sensitive subsystems can now be tested in isolation.
What ADP000 will not catch#
A single dead key (NDK001 catches some keyboard faults but misses intermittent stuck keys), an intermittent display flicker that does not happen in the test window, a Thunderbolt port that fails only at full 40 Gb/s under sustained throughput, SSD endurance and wear, sustained-load thermal throttling, battery condition beyond the binary PPT codes, and repair history. Each of those gaps is what one of the other layers is for.
Layer 2: AST 2, GSX, and MRI (technician-only)#
The professional diagnostic stack is real and is not available to you. Recognizing what it is helps you recognize fraudulent claims of access.
Global Service Exchange (GSX) is Apple's portal where authorized technicians look up serials, warranty status, configuration, and repair history. Apple Service Toolkit 2 (AST 2) is a cloud-delivered diagnostic platform launched from a Diagnostic Console on a tech's Mac or iPad. AST 2 pushes the appropriate diagnostic image to the customer's device wirelessly and reports results into GSX's Global Diagnostic Exchange. Its central engine is the Mac Resource Inspector (MRI), a rapid system-wide roll-call that queries every component on the PCI/PCIe, I²C, and USB buses for physical presence, firmware integrity, and core electrical health.
On Apple Silicon, a final cryptographic step closes the loop. After a part is replaced, AST 2 cryptographically pairs the part's unique identifier with the Secure Enclave and logic board via Apple's calibration servers, and a final MRI sweep registers the calibration as successful. That handshake is what flips the Parts & Service pane status from Finish Repair to Genuine.
The consumer-facing equivalent is the Self Service Repair "Apple Diagnostics for Self Service Repair" portal, which runs the same Apple Diagnostics image you can already invoke locally. It does not grant AST 2 access.
Any third party offering an "AST 2 diagnostic report" without an in-person visit to an Apple Store or Apple Authorized Service Provider is misrepresenting ordinary Apple Diagnostics output, scraping Apple's public Coverage Check, or fraudulent. The scam pattern is now common enough to be its own category.
Layer 3: Third-party tools (what each one actually answers)#
No single tool does everything. Apple Diagnostics covers core logic-board components on-site but hides battery and storage detail. The tools below fill those gaps, and each targets a different layer of the hardware stack. The per-tool diagnostic comparison walks the four tools side by side.
CoconutBattery#
Queries the smart-battery system via IOKit to expose design capacity, Full Charge Capacity (FCC) in mAh, cycle count, battery manufacture date, real-time wattage, and temperature. The paid Plus tier (one-time purchase from coconut-flavour.com, listed at $9.95 in a 2022 review) adds internal-SSD data-written totals. Its capacity figure is a passive read of the gas-gauge register and can differ from macOS's internally calculated Maximum Capacity, fluctuating with temperature and discharge state.
smartmontools / smartctl#
The canonical open-source SMART reader, installed via Homebrew:
# Apple Silicon (Homebrew default prefix /opt/homebrew)
brew install smartmontools
sudo smartctl -a /dev/disk0
Everything DriveDx surfaces is available here as raw values, free of charge. The trade-off is no GUI and the need to read raw NVMe Log 0x02 fields yourself. Each SMART value on macOS and what it actually means covers the per-field decoding.
DriveDx (BinaryFruit)#
Same NVMe SMART data as smartctl with a GUI, a four-tier health verdict (OK / Warning / Failing / Failed), trend logging, menu-bar status indicator, and email alerts. Pricing as of May 2026 (binaryfruit.com/store): $19.99 Personal (up to 3 Macs) / $39.99 Family (up to 6 Macs), reflecting a 20% promotion off list prices of $24.99 / $49.99. v1.12.1 (September 2023) is the current release; the developer confirms it as fully compatible with macOS 26 Tahoe.
Caveat on external drives: USB enclosures often do not pass SMART through (a bridge-chip limitation, not a drive fault). Thunderbolt enclosures generally do.
EtreCheck#
A system-report aggregator that bundles roughly 50 checks (hardware, battery age, disk SMART summary, RAM, system load, launch agents, kexts, Time Machine status, recent crashes, adware indicators) into a single PII-redacted report. Requires Full Disk Access for the full picture. Its highest-value flag for buyers is active configuration profiles, which indicate MDM enrollment.
Tool selection#
| Scenario | Recommended combination |
|---|---|
| Casual user, one-time check | Apple Diagnostics + CoconutBattery + EtreCheck (all free) |
| Power user / pre-sale audit | Add smartctl (free, scriptable) |
| Long-term multi-drive monitoring | DriveDx earns its keep |
DriveDx, smartctl, and CoconutBattery Plus all read the same NVMe SMART data; EtreCheck summarizes a subset.
Layer 4: Parts & Service History (macOS Tahoe 26, Apple Silicon only)#
Introduced on Mac in macOS Tahoe 26 (released September 15, 2025) as part of Apple's rollout of Repair Assistant to the Mac. The pane lives at System Settings → General → About → Parts & Service and is documented at support.apple.com/en-us/123123. Apple Silicon only. The pane appears dynamically, only if the Mac detects that a tracked component was repaired or replaced.
How verification works#
Genuine Apple parts ship with individual calibration coefficients uploaded to Apple's servers. When a tracked part is replaced, a technician runs Repair Assistant, which retrieves the calibration files, verifies the cryptographically signed certificates, and links the component to the Secure Enclave. Clicking a part (once the Mac is online) shows the service date. Only the most recent repair per part is shown.
If System Integrity Protection (SIP) is disabled (a common step for developers running custom kernel drivers), macOS automatically disables the pane. SIP must be enabled for secure hardware auditing to function. A disabled pane with a security alert on a used Mac is its own signal.
Status labels#
| Label | Meaning |
|---|---|
| Genuine | Authentic Apple part that completed the cryptographic handshake and calibration. |
| Used | Authentic Apple part harvested from another (donor) Mac; functions normally but recognized as migrated. |
| Unknown | Validation failure (third-party clone, malfunctioning, modified, or installed without completing calibration). Triggers a persistent lock-screen notification for five days. |
| Unverified | Logic-board-specific: the board was previously replaced but cannot be verified. May impact security-dependent features such as Apple Pay. |
| Finish Repair | The repair is incomplete because final calibration was not run; features like Touch ID or True Tone stay disabled until Repair Assistant completes. |
Tracked components by model series#
| Model series | Tracked components |
|---|---|
| MacBook Pro | Logic board, Touch ID board, lid angle sensor (M5 models) |
| MacBook Air | Logic board, Touch ID board, lid angle sensor (M5 models) |
| MacBook Neo | Logic board, Touch ID board, display assembly |
| iMac, Mac mini, Mac Studio, Mac Pro | Logic board |
What it does not show#
A complete service history (software diagnostic visits, AppleCare claims). Parts the Mac cannot fingerprint (chassis swap, fan replacement, in most cases a battery replacement). Anything on Intel or pre-Tahoe Macs. For warranty and coverage status, the buyer still checks checkcoverage.apple.com separately.
The reading guide for each label, in the context of a buyer's bench, is in the Parts & Service walkthrough.
Sustained-load behavior: thermals, throttling, memory#
Apple Diagnostics is a quick presence test and does not simulate hours of heavy load. Real-world sustained workloads (rendering, compilation, local LLM inference) reveal thermal and memory behavior the diagnostic never touches.
sudo powermetrics -s thermal exposes a Current pressure level field with values Nominal / Moderate / Heavy / Trapping. Heavy means the Mac is actively throttling. asitop (pip install asitop, needs sudo) and macmon (Rust, no root) give the same data in an htop-style view.
Real numbers: a passively-cooled M1 MacBook Air throttles roughly 15% after about 10 minutes of max CPU load. An M2 Pro/Max under sustained Cinebench or Blender load can reach roughly 100 degrees Celsius at the package and drop P-core clocks from about 3.2 GHz to about 2.1 GHz within a minute, a 30 to 40% throughput loss. M3/M4 generations behave similarly; fan curves and chassis dominate the outcome.
On Apple Silicon's unified memory, Activity Monitor's Memory pressure (green/yellow/red) and Swap Used pages are what matter. Sustained yellow or red on an 8 GB Mac correlates with multi-terabyte monthly SSD writes that accelerate Percentage Used. The only real mitigation is to size RAM to the workload at purchase, because unified memory cannot be upgraded later.
NVMe SMART on Apple Silicon SSDs#
On Apple Silicon, the SSD is raw NAND wired directly to the SoC with the NVMe controller integrated into Apple silicon itself. You cannot replace it in the normal sense, and a physical NAND failure renders the Mac unbootable, even from an external drive, because iBoot must execute through the internal NAND controller. SSD-health monitoring is high-stakes.
sudo smartctl -a /dev/disk0 returns the standard NVMe Log 0x02 fields: Critical Warning, Temperature, Available Spare, Available Spare Threshold, Percentage Used, Data Units Read, Data Units Written, Host Read/Write Commands, Controller Busy Time, Power Cycles, Power On Hours, Unsafe Shutdowns, and Media and Data Integrity Errors. Apple does not expose vendor-specific attributes. Disk Utility shows only PASSED/FAILED.
The Apple quirk worth knowing: Available Spare Threshold often reports in the 90s (99 is common) rather than the typical 10. The absolute number is misleading; what matters is whether Available Spare is less than or equal to Threshold, which is the actual failure trigger.
Each Data Unit equals 1000 × 512 bytes = 512,000 bytes per the NVMe Base Specification. The raw counter excludes NAND metadata, filesystem catalog updates, and the SSD's own maintenance writes, so Percentage Used can rise faster than a naive host-write calculation predicts. Apple does not publish a TBW endurance spec, so the practical approach is trend-on-the-same-drive: record Percentage Used and date, wait 30 to 60 days, record again, linearly extrapolate to 100%. A worked example M1 MacBook Pro at 75 days showing 2% used and about 82 TB written extrapolates to roughly 9 to 10 years at that workload.
Battery cycle count and Battery Health Management#
Per support.apple.com/en-us/102888, every MacBook Pro, MacBook Air, and 12-inch MacBook from 2009/2010 onward is rated for 1000 cycles (including the newest MacBook Pro 14-inch M5 and MacBook Air M4, 2025). Older models are rated 500 or 300 cycles. At the cycle limit, Apple expects the battery to be at 80% or less of original design capacity; the Mac keeps working, life shrinks, the Service Recommended flag flips on.
Battery Health Management on Apple Silicon notebooks (support.apple.com/en-us/102589) actively monitors temperature history and charging patterns to slow chemical aging. Maximum Capacity % can fluctuate ±5% even on a healthy battery. pmset -g batt | grep "Charge limit" returns Charge limit: on when macOS has capped charging at 80%.
If Maximum Capacity drops below 80% within the one-year warranty or AppleCare+ period, Apple replaces the battery at no charge. Past 1000 cycles, it is a paid wear-and-tear replacement. The 1000-cycle rating walkthrough covers the dynamics.
Pre-purchase and pre-listing workflows#
Before money changes hands, work the following six in person. Screenshots can be fabricated; verify on the device.
- Activation Lock OFF in System Information → Hardware → Activation Lock Status. Enabled is a walk-away until the seller signs out of iCloud and reboots to the Hello screen.
- No MDM/management profile in System Settings → General → Device Management.
- ADP000 from Apple Diagnostics. Any PPT, PPM, VFD, PFM, or PFR code is a serious negotiating point or walk-away.
- Battery cycle count against the model's limit (1000 for any 2010-or-later notebook) plus Maximum Capacity % and Condition from System Information → Power.
- SSD wear via
sudo smartctl -a /dev/disk0. Heavy wear (above 50% used) on a sub-three-year machine is unusual. - Parts & Service pane on macOS Tahoe 26 or later. Every row Genuine, or an empty pane.
The first two are vetoes. The other four are negotiating leverage. For the full pre-purchase walkthrough, verifying a used Mac before buying with every option compared covers the device-side checks. The post-purchase counterpart, Cinebench plus Blackmagic plus Apple Diagnostics inside the 14-day return window, covers the stress-test phase.
For sellers, the analogous step is to document the same six signals before running Erase All Content and Settings on macOS Monterey 12 or later (support.apple.com/en-us/102664). Save the screenshots: About This Mac, System Information → Power, System Settings → Battery → Battery Health, CoconutBattery, full smartctl -a /dev/disk0 output, the ADP000 result, the Parts & Service pane (or its absence), and the checkcoverage.apple.com page. Buyers trust standard artifacts, and measured listings sell faster and higher.
Thresholds that should change your action regardless of what the listing says: Available Spare at or below Threshold, Critical Warning not 0x00, or Media and Data Integrity Errors above 0 means back up immediately. Percentage Used 90% or higher means SSD wear-out within 1 to 2 years. Service Recommended plus Capacity below 80% plus cycle count near 1000 means budget for the Apple battery tier. Sustained Heavy thermal pressure under a normal workload means check fans first.
What this means for the reader#
The 2026 Mac diagnostic stack is layered, and each layer answers a question the previous one cannot. Apple Diagnostics is the floor; ADP000 is the only clean result and a presence/threshold pass, not exhaustive. AST 2 and GSX are technician-only, and any "remote AST 2 report" offered without an Apple Store or AASP visit is fraudulent. CoconutBattery, smartctl, DriveDx, and EtreCheck fill the gaps Apple deliberately hides in consumer surfaces. Parts & Service on macOS Tahoe 26 closed the non-genuine-part gap for Apple Silicon. powermetrics -s thermal covers sustained load; Heavy under a normal workload means active throttling.
The pre-purchase checklist boils down to six items: Activation Lock off, no MDM profile, ADP000, cycle count under the model's limit, Percentage Used under 25% on a sub-three-year machine, and every Parts & Service row Genuine. The first two are walk-aways. The other four are negotiating leverage. On a maxed Mac Studio or 16-inch MacBook Pro, the difference between "all clean" and "Unknown logic board + 900 cycles + 35% Percentage Used" is several thousand dollars. The 15 minutes it takes to verify is the cheapest insurance available on a used Mac purchase.
Run the free report and list your Mac with proof. A verified listing carries the badge on the Macfax shelf, in front of buyers filtering for it.
Related posts
How to run diagnostics on a Mac: every method compared
There are five consumer-accessible ways to test a Mac's hardware health (Apple Diagnostics, CoconutBattery, smartctl, DriveDx, EtreCheck) and one technician-only stack you cannot run yourself. Each answers a different question. Running one is not running all five.
How to use Apple Diagnostics: invocation, ADP000, and what to do next
Apple Diagnostics returns one of two things: ADP000 (no issues found) or a three-letter-plus-three-digit code. ADP000 is shallow by design. Here's how to read the result, when to rerun, and which third-party tool fills which gap.
Apple Diagnostics: how to start the test on Apple Silicon and Intel Macs
Apple Silicon Macs start Apple Diagnostics from the startup-options window with Command-D, not the old hold-D-at-boot keystroke. Here's the exact sequence on both architectures and what to disconnect before you start.
Written by
Marcus WilliamsMarcus Williams covers Mac hardware and repair for Macfax. He spent six years on the bench at an Apple Authorized Service Provider in the Pacific Northwest before going independent, most of that time on logic-board repair, display assembly swaps, and the failure patterns Apple's diagnostics don't surface. He writes about what's inside a Mac, what breaks first, and what a serial number can and can't tell you about a unit's history.
More posts by Marcus →